
TheAIMeters Data Brief · First edition
AI Physical Footprint
Electricity, water use and carbon estimates for November 2026
A versioned snapshot of modelled global annualized estimates. These figures are not official telemetry or direct measurements of every AI system.
Three estimates, one disclosure gap
AI services depend on physical infrastructure, but no regulator or operator publishes a complete global account of the electricity, water and carbon associated with AI workloads. The available picture has to be assembled from public research, infrastructure disclosures and explicit modelling assumptions.
This first TheAIMeters Data Brief presents a versioned snapshot of the November 2026 model. It separates central estimates from ranges, explains what each figure includes, and records why the model changed. The purpose is not false precision: it is a traceable order of magnitude that readers can cite, challenge and update.
The useful number is not the most precise-looking number. It is the estimate whose scope, uncertainty and revision history can be inspected.
The November 2026 snapshot
Central values are annualized global estimates based on a 2025 evidence base. Ranges are either published estimate ranges or explicit TheAIMeters sensitivity envelopes; they are not statistical confidence intervals.
In this brief, “from operating AI infrastructure” means impacts associated with running compute, cooling equipment and electricity generation within the stated boundary. It does not include a complete lifecycle account of hardware manufacturing and construction.
Electricity
150 terawatt-hours per year
Indicative range · 100–200 terawatt-hours per year
Water
540 billion liters per year
Indicative range · 312.5–764.6 billion liters per year
Carbon
52.5 million tonnes CO₂e per year
Indicative range · 32.6–79.7 million tonnes CO₂e per year
Putting the scale in context
Using the same directional assumptions as TheAIMeters’ visual comparison page, the central annual estimates correspond approximately to:
These comparisons illustrate scale only. They are not local impact equivalents and do not imply that AI use directly removes these resources from households, people or transport.
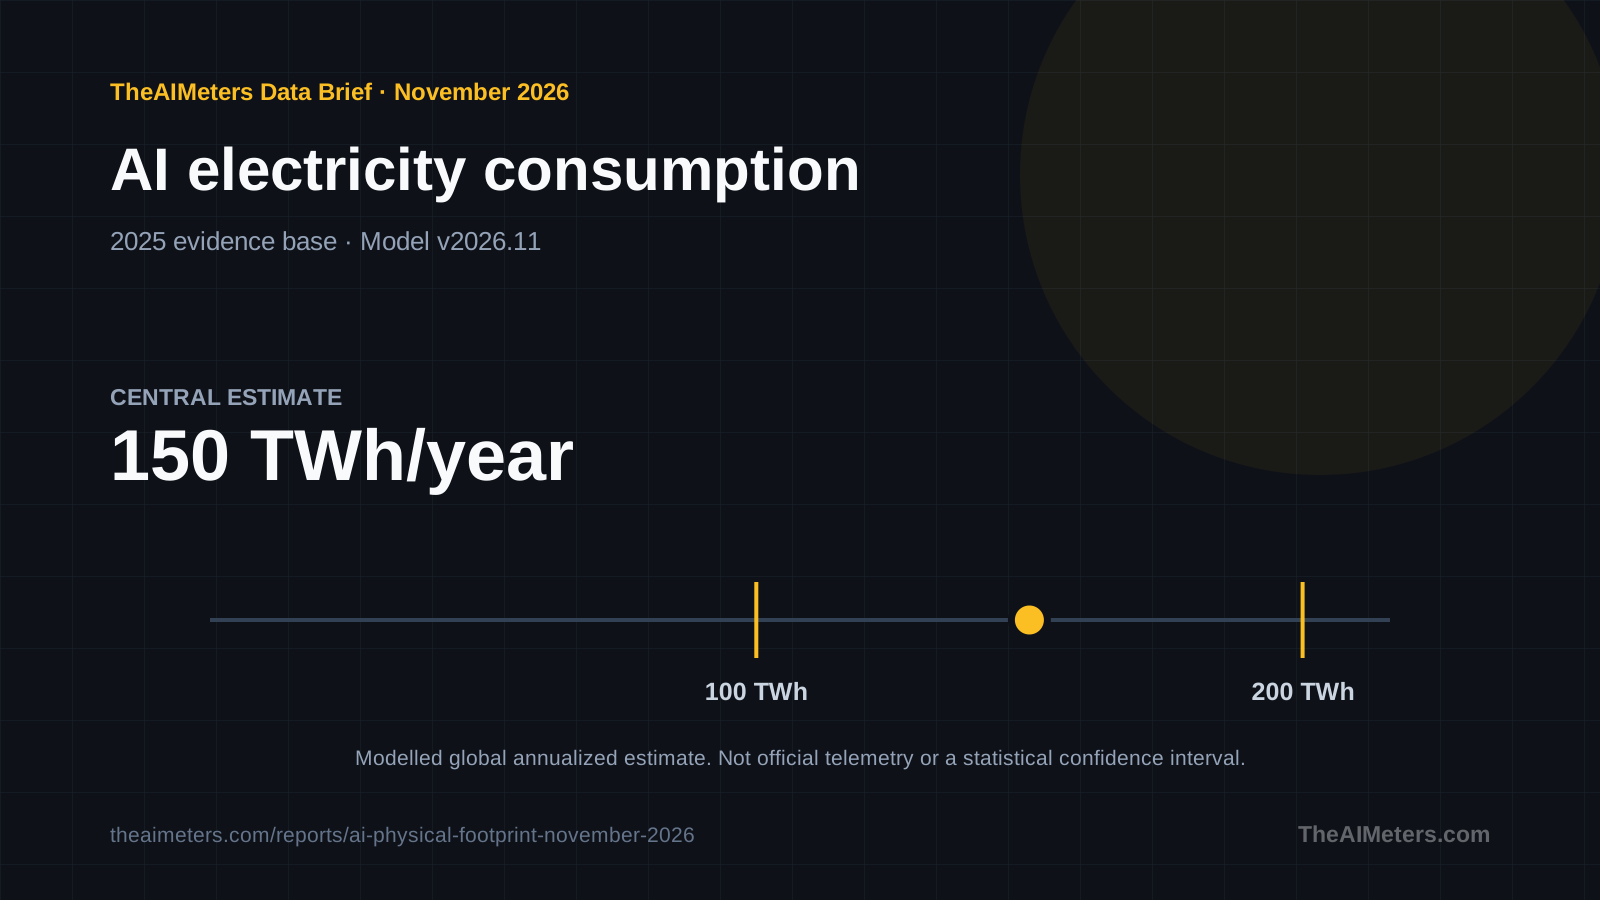
AI electricity consumption
A modelled global annualized estimate for electricity associated with AI-focused datacenters and AI workloads.
- Central estimate
- 150 terawatt-hours per year
- Indicative range
- 100–200 terawatt-hours per year
- 2025 evidence base
- Medium confidence in the order of magnitude; low confidence in any more precise global total.
Estimate basis
The central value follows the IEA 2026 Base Case estimate of approximately 150 TWh for AI-focused datacenters in 2025. The surrounding range is a TheAIMeters sensitivity envelope informed by public installed-capacity estimates.
Included scope
Operational electricity for AI compute and associated datacenter overhead represented in the source estimate.
Outside scope
A complete lifecycle inventory of hardware manufacturing, construction and grid expansion.
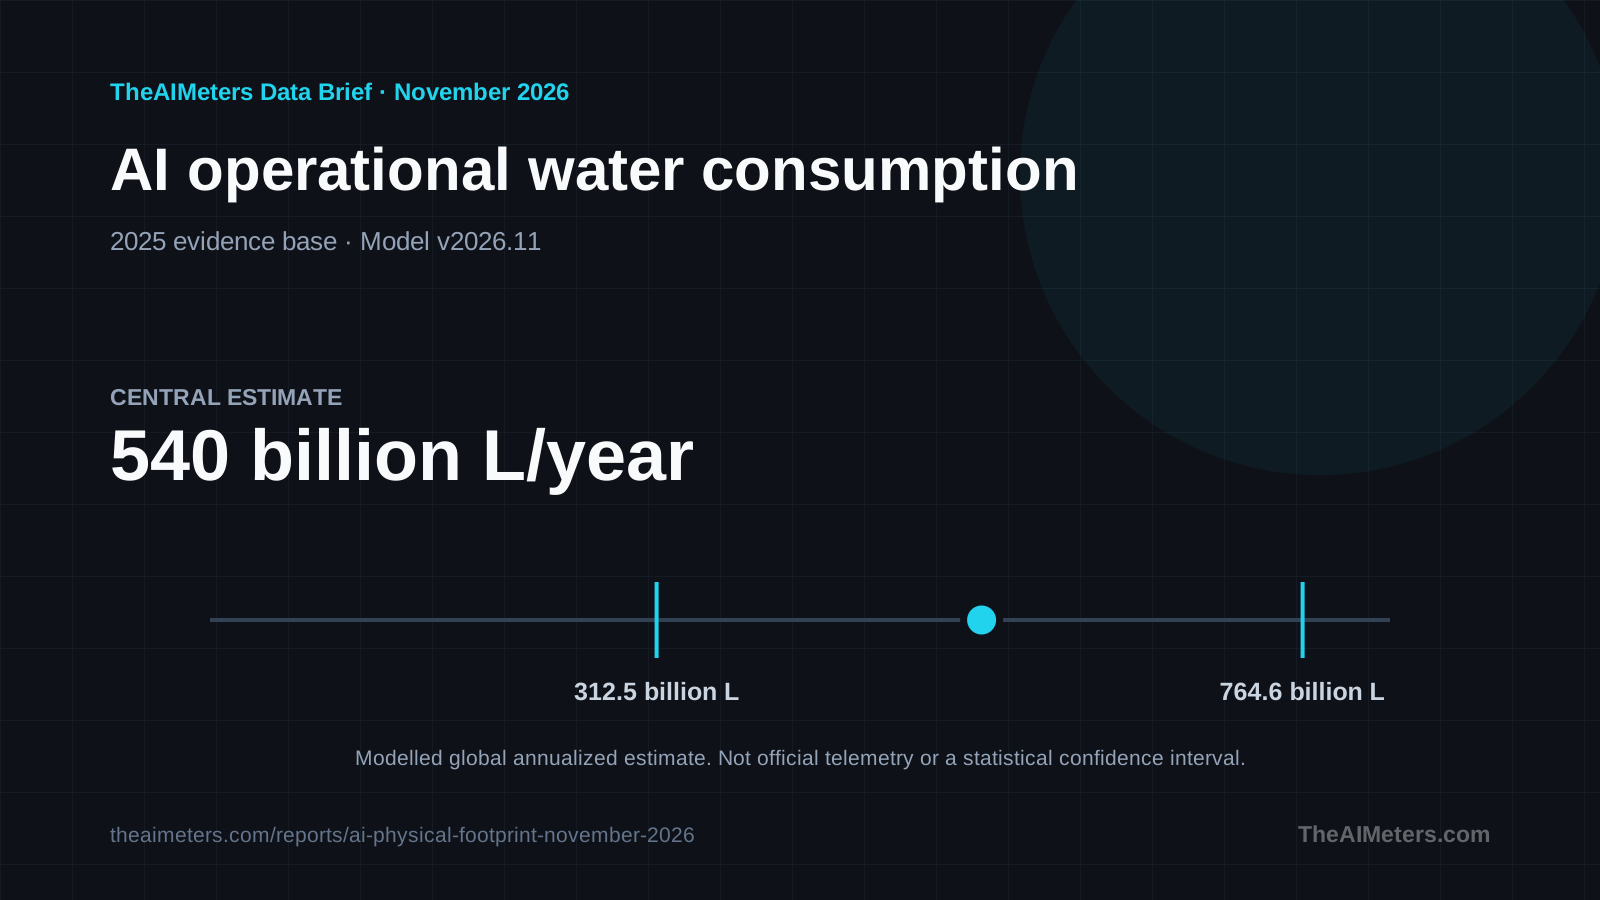
Water consumption from operating AI infrastructure
A modelled global annualized water footprint associated with operating AI infrastructure.
- Central estimate
- 540 billion liters per year
- Indicative range
- 312.5–764.6 billion liters per year
- 2025 evidence base
- Low confidence because cooling systems, locations, grid mixes and operator disclosures vary widely.
Estimate basis
The range is published by de Vries and Gao for 2025. The 540 billion litre central value is a rounded synthesis near its midpoint, used to drive the current TheAIMeters model.
Included scope
Direct cooling water and indirect water associated with electricity generation within the cited operational scope.
Outside scope
A complete lifecycle water inventory for semiconductor manufacturing, construction and every local watershed impact.
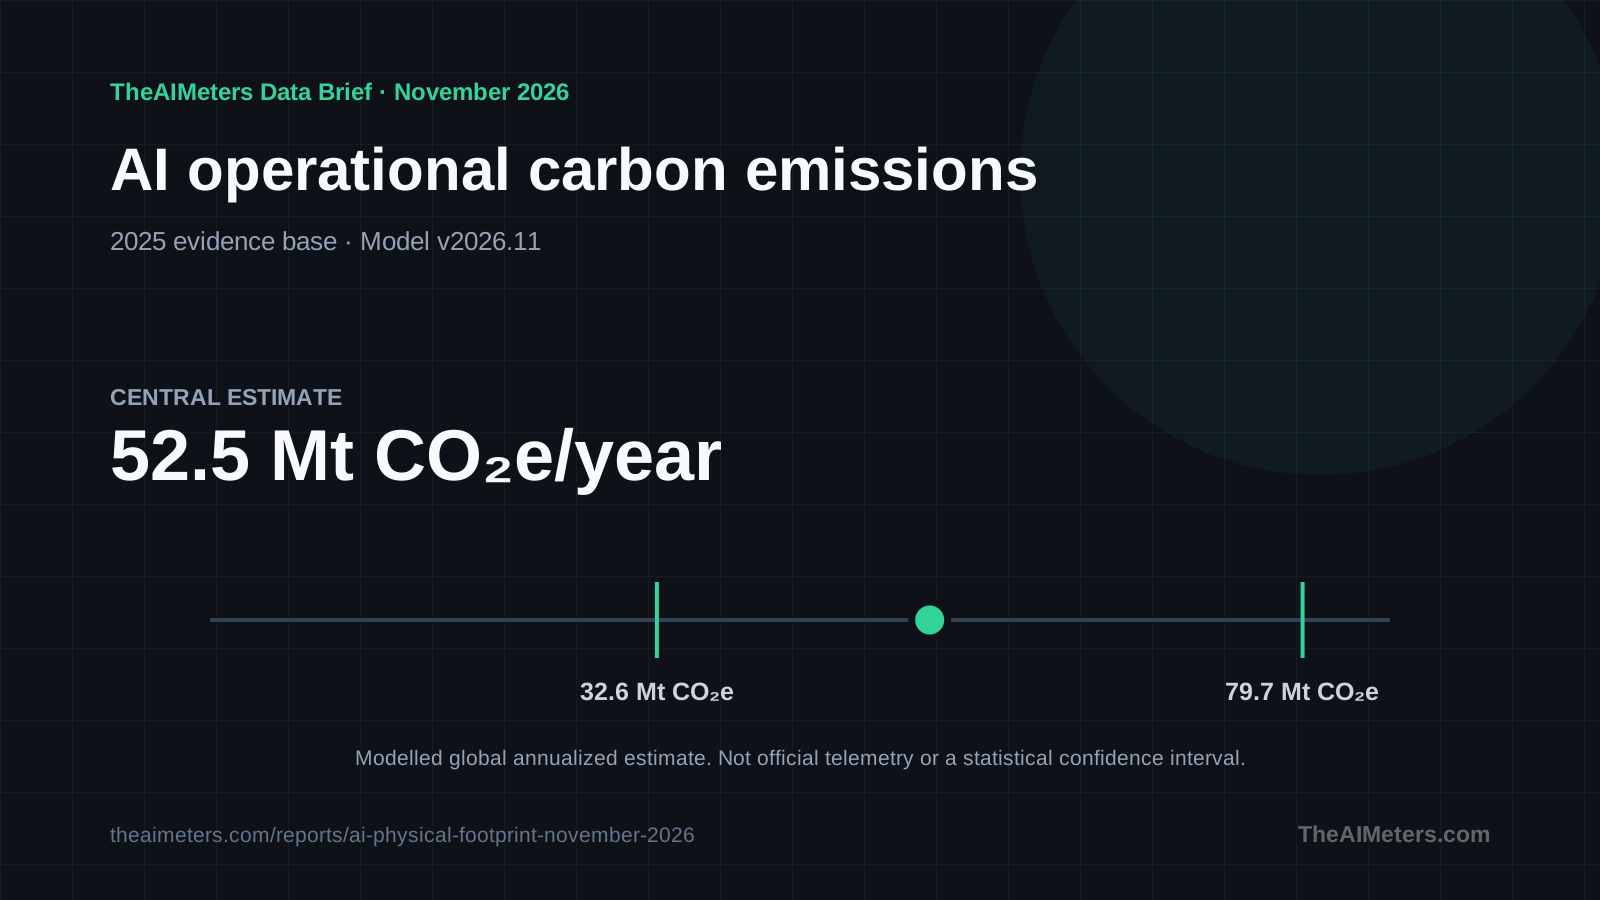
Carbon emissions from operating AI infrastructure
A modelled global annualized estimate of emissions associated with the electricity used to operate AI infrastructure.
- Central estimate
- 52.5 million tonnes CO₂e per year
- Indicative range
- 32.6–79.7 million tonnes CO₂e per year
- 2025 evidence base
- Low confidence because the result changes materially with datacenter location and electricity mix.
Estimate basis
The central value applies an explicit global operational factor of 0.35 kg CO₂e/kWh to the 150 TWh electricity estimate. The broader range is published by de Vries and Gao for 2025.
Included scope
Electricity-related operational emissions represented by the global-average factor and published range.
Outside scope
A complete lifecycle inventory of chips, servers, buildings, backup systems and transmission infrastructure.
How to read these figures
The brief deliberately distinguishes the type of information being shown.
Modelled estimate
A reproducible calculation anchored to public evidence. It is useful for scale, not a substitute for audited telemetry.
Published range
A range reported by a cited study. Its endpoints still depend on the study’s scope and assumptions.
Sensitivity range
A TheAIMeters envelope showing how the result changes under defensible assumptions. It is not a confidence interval.
Live counter
An animation of the annualized model accumulating through the year. Recording it daily does not create an independent observation.
Why the estimates changed
The November model materially revises the April baselines: electricity from 60 to 150 TWh, water from 30 to 540 billion litres, and carbon from 21 to 52.5 Mt CO₂e. These changes reflect evidence recalibration and a clearer operational scope, not measured growth over seven months.
The water revision is especially large because the earlier baseline used a limited intensity factor, while the current scope includes both direct cooling and electricity-linked indirect operational water.
The missing public ledger
Operators increasingly report company-wide energy, water and climate metrics, but those disclosures rarely isolate AI workloads, individual facilities, training runs and inference services in a comparable way. Power capacity, annual electricity, water withdrawal, water consumption and emissions are also different measures and should not be merged.
Better disclosure would publish comparable facility-level data, workload boundaries, location-aware electricity factors and revision histories. Until then, global AI totals remain estimates. TheAIMeters makes that uncertainty visible instead of presenting the counters as audited measurements.
Methodology in brief
The snapshot uses the versioned environmental data pack reviewed on 16 November 2026. Each indicator has a canonical meter, a documented methodology, a central estimate, a range, an evidence year and a source list. The published PDF and charts preserve this version even when the live model is revised later.
Ranges describe uncertainty in scope and assumptions. They should not be interpreted as statistical confidence intervals or exact minimum and maximum values.
Full methodology, machine-readable data and source notes are available on TheAIMeters.
Reuse, attribution and citation
The numerical data, tables and charts in this brief may be reused under CC BY 4.0 with attribution to TheAIMeters and a link to this edition.
The licence does not cover the TheAIMeters name or logo, editorial prose outside the reusable tables and charts, website design, or third-party source material.
Suggested citation
TheAIMeters (2026). AI Physical Footprint — November 2026 Data Brief (1st ed., model v2026.11). https://www.theaimeters.com/reports/ai-physical-footprint-november-2026